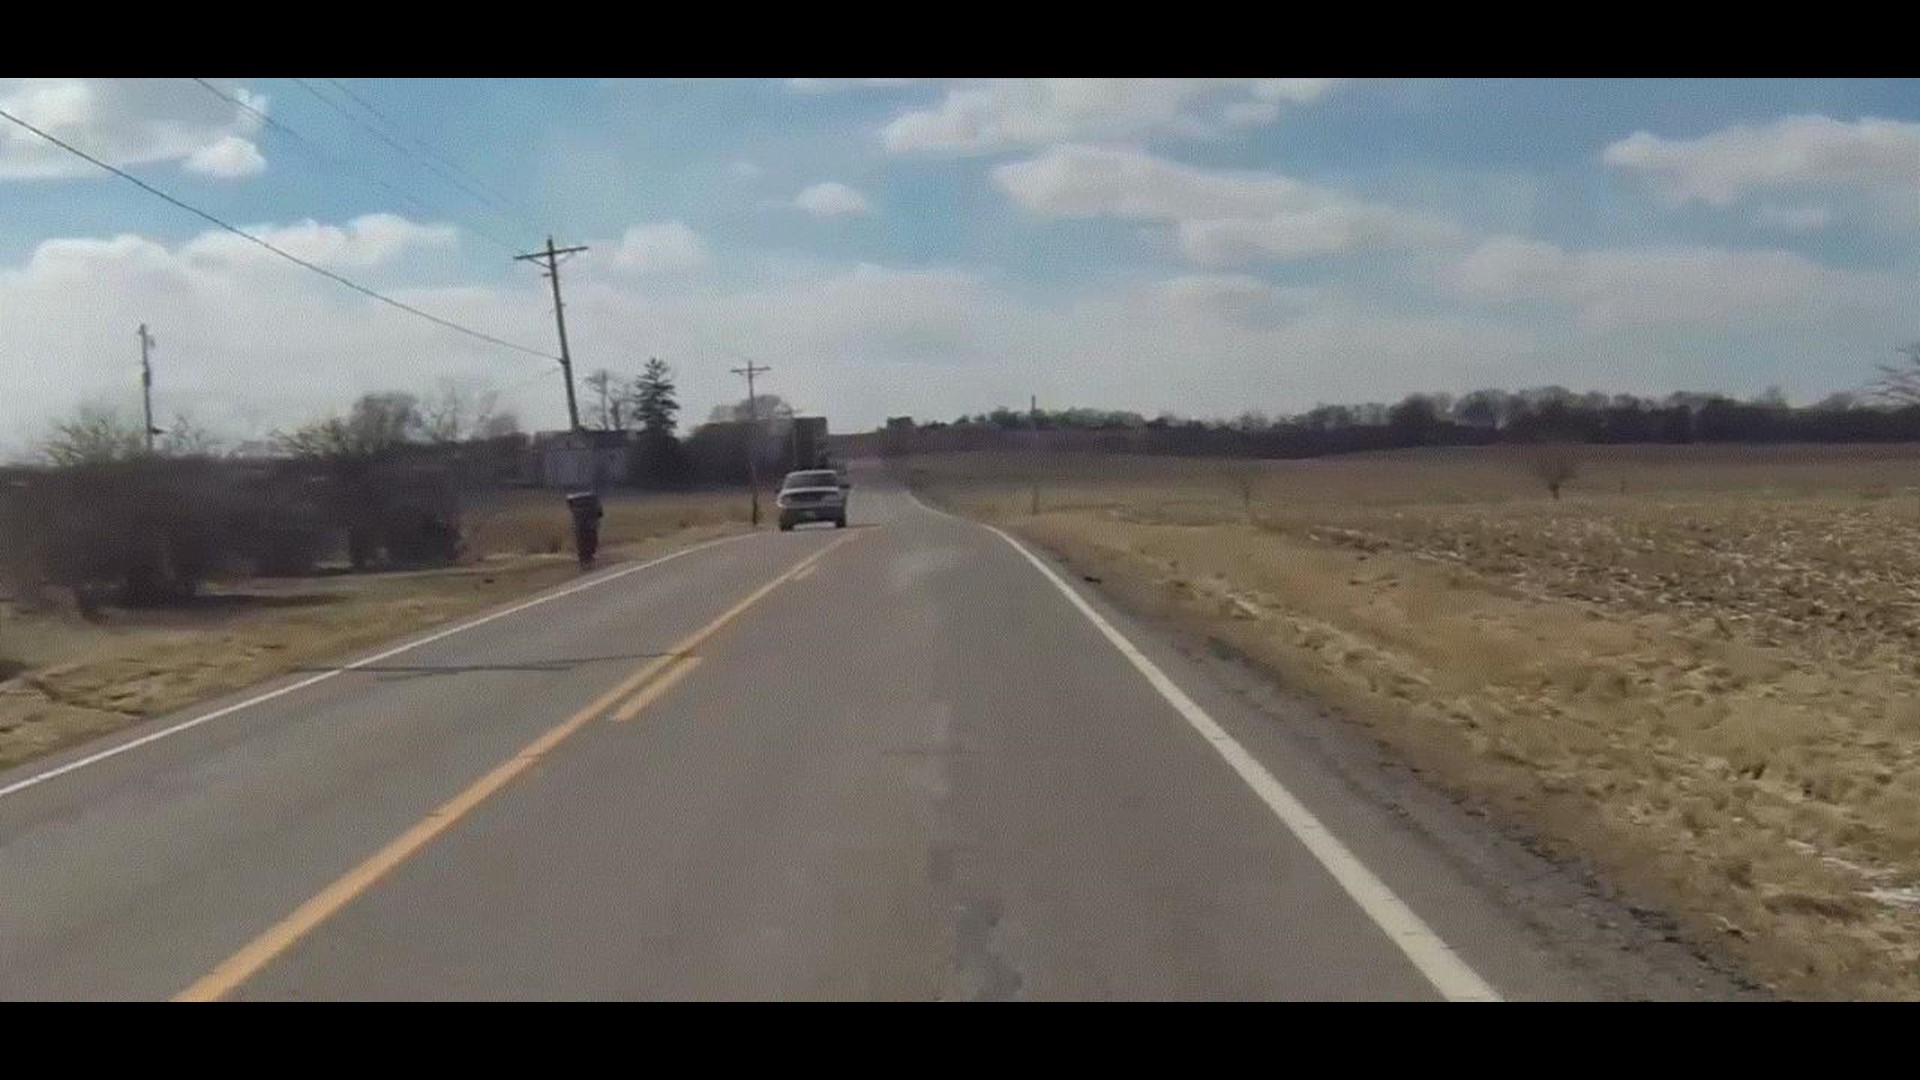
When it comes to fatal car crashes in Ohio, the numbers are going down.
But, the number of people dying on rural roads is much greater than those who travel
in urban areas.
Numbers from the Ohio Highway Patrol show that on average, more than 500 people have died in rural road fatal crashes since 2010. That's more than double the fatal crashes on urban roads during the same time.
There's something about driving on a country road that the patrol says makes drivers feel like hitting the gas.
“One of the biggest things we see on rural route fatalities is speed,” said Trooper Craig Cvetan.
Cvetan says he's clocked drivers going 80 miles per hour and higher. He says speed kills more people on rural roads because two lanes roads leave drivers little room for error.
“You have just a few feet separating you."
When a car goes left of center, the outcome is often fatal. It happened on State Route 161 in Union County last month were three people died in a crash.
Troopers say rural roads pose different challenges for drivers. There are people pulling out from driveways or merging from township roads.
“There are curves, there are hills. They are not designed for people to be going 70 miles an hour like they do on the Interstate.”
According to the patrol, over the past five years, fatalities on rural roads in Ohio have overwhelmingly been higher than fatal crashes in urban areas.
The patrols numbers say the highest number of deaths, 774, happened in 2012.
The number of deaths on urban roads never exceeded 351 during the same time period.
Already this year, fatalities on rural roads are six times higher than those on urban roads.
The patrol says while speed is an issue, often times inattentive driving is the fastest way a drive in the country can turn deadly.
“It's very important when you're driving at 55 miles per hour on a rural route to be a defensive drive also,” added Cvetan.
The highway patrol says most fatal crashes on rural roads occur within a 30 mile radius from where the driver or passenger lived.
WEB EXTRAS
Ohio Crash Statistics
Year Crashes/Killed Rural/Killed Urban/Killed
2010 984/1080 659/729 325/351
2011 942/1016 617/666 325/350
2012 1024/1122 696/774 328/348
2013 912/983 600/651 312/332
2014 66/76 56/65 10/11
National Reports
U.S. Transportation Department Data

